UA Engine
Ad-material-based ROI, multi-dimensional cross analysis model with full link data, real-time verification of the effectiveness of the ad placements strategy.
Request a demo


Data overview
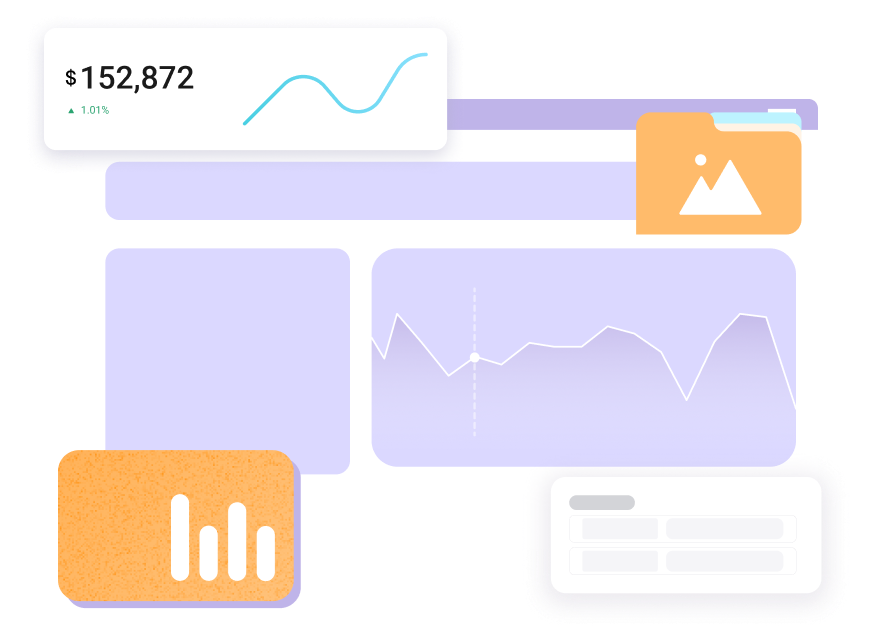
Company leader or project leader can view the change of key metrics yesterday or in the last seven days in the ROAS dashboard.
View the current and compared key metrics of the previous phase, including spend, revenue, profit, total ROI, conversion, CPI, ARPU, ROI-0D.
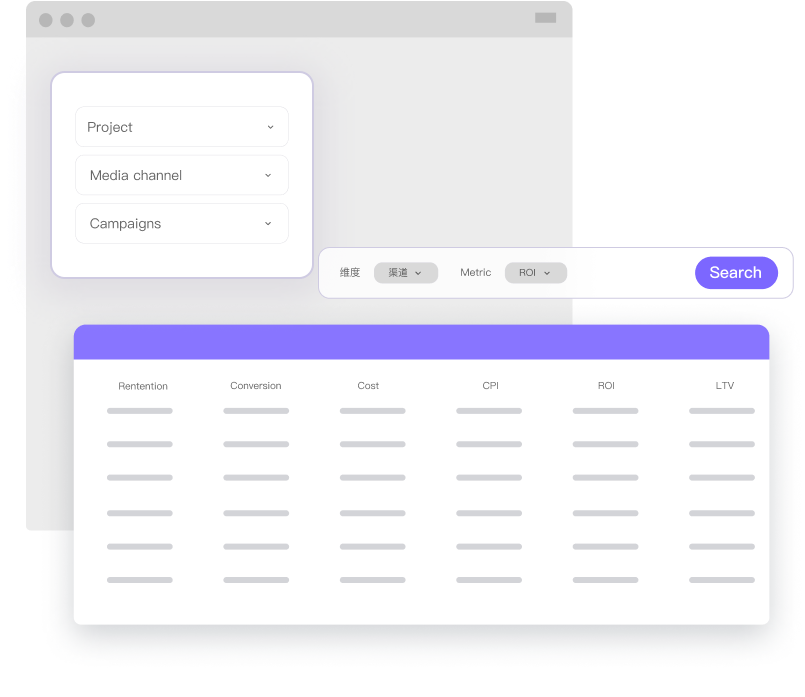
After finding abnormal metrics of a project or channel, select the dimensions to analyze and learn the comprehensive information behind the abnormal data.
Applicable roles
Project leader
Dashboard metrics
Conversions , Cost, Revenue, ROI, etc
Purpose of analysis
Quickly view the data overview to find data change nodes
Real-time dashboard
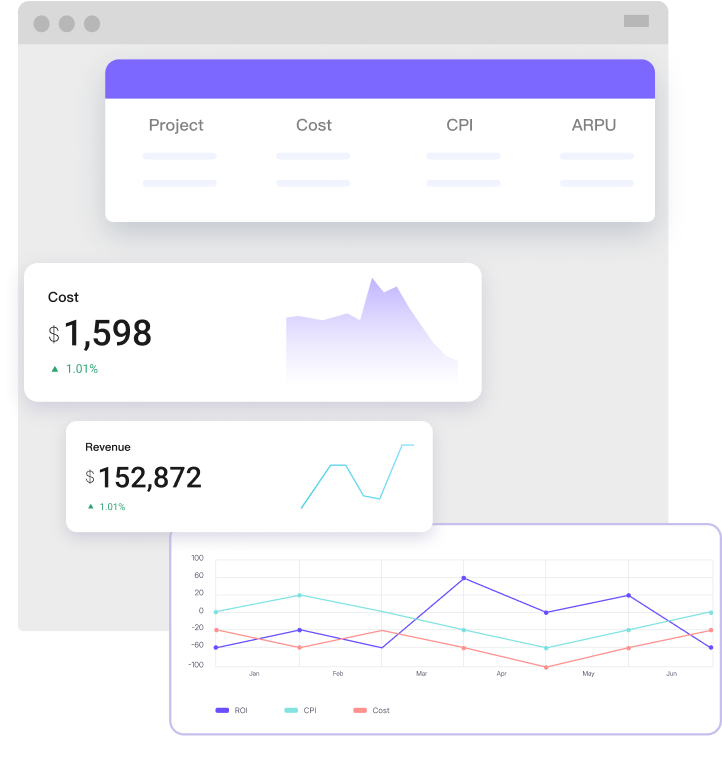
Provides real-time ROI visual dashboard, which can view hourly ROI trend chart by channel and project dimension, so that optimizers can quickly understand the metrics and optimize advertising strategies in time.
Applicable roles
Optimization specialists
Dashboard metrics
ROI, Cost, Conversions, Conversion cost, CTR, CVR, etc
Purpose of analysis
Quickly view and analyze the overall ROI and further analyze the underlying reasons for the change in metrics


Contemporaneous group dashboard
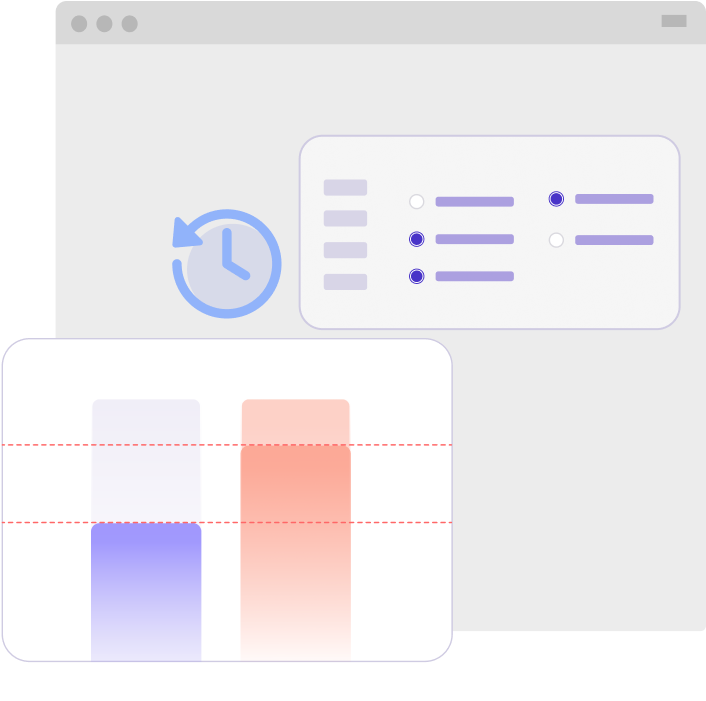
Quickly group users in the same time period, and then see their subsequent behavior, such as ROI, retention number, retention changes.
You can perform comparative analysis, breaking down user groups by campaign or media channel, etc. in order to help uncover patterns or changes in users or campaigns.
Applicable roles
Optimization specialist, product operation
Dashboard metrics
ROI, LTV, revenue, retention, etc
Purpose of analysis
Quickly switch to view and analyze different retention metrics for products